itrprof SQL Analyzer 6.2.7 User Manual
|
itrprof SQL Analyzer 6.2.7 User Manual |
Contents
Corrupted Lines and Their Dependents
Overall Statistic Totals for All NON-SYS Statements
Overall Service Histogram Totals for All NON-SYS Statements
Overall Wait Totals for All NON-SYS Statements
Overall Wait Histogram Totals for All NON-SYS Statements
Overall Tuning Advices for All NON-SYS Statements
Overall Statistic Totals for All SYS Statements
Overall Service Histogram Totals for All SYS Statements
Overall Wait Totals for All SYS Statements
Overall Wait Histogram Totals for All SYS Statements
Overall Tuning Advices for All SYS Statements
Overall Wait Totals for All UN-KNOWN Statements
Overall Wait Histogram Totals for All UN-KNOWN Statements
Overall Tuning Advices for All UN-KNOWN Statements
Top Statements Ordered by Elapsed Time
Top Statements Ordered by Service Time
Elapsed Time Totals for Statement
Statistic Totals for Statement
Service Histogram Totals for Statement
Cumulative Statistic Totals for Statement
Cumulative Time Cost Distribution for Child Statements of Statement
User Interface Parameters List
itrprof SQL Analyzer is a web based tool which analyzes SQL_TRACE and Event 10046 trace files of Oracle; finds bottlenecks and offers information on how to tune them. This tool is developed by using java servlet technology.
itrprof SQL Analyzer does not use any database connections. It uses its own data structures.
SQL trace files consist of 3 parts: SQL_TRACE, Binds and Waits.
SQL_TRACE is the minumum level of trace file. SQL_TRACE file includes:
parse,exec,fetch,unmap, sort unmap operations
Binds and Waits trace files include binds and waits respectively plus SQL_TRACE.
The following table defines levels of trace files:
|
Level |
Includes |
|---|---|
|
1 |
Standard SQL_TRACE functionality |
|
4 |
Level 1 plus Bind variables |
|
8 |
Level 1 plus Waits |
|
12 |
Level 1 plus Bind variables and Waits |
It's strongly recommended that TIMED_STATISTICS parameter should be TRUE before preparing trace files if time based data in trace file will be formatted. If is's set to FALSE , timing information of Service time, Elepased time and Wait time will be zero (0).
Note that some platforms such as desktop platforms record ELAPSED times only even if TIME_STATISTICS=TRUE.
There are several ways to set TIME_STATISTICS parameters. The following table gives these methods:
|
Activation |
Enable |
Disable |
|---|---|---|
|
for current instance |
Add init.ora: timed_statistics=true
for 7.3 onwards: alter system set timed_statistics=true; |
Add init.ora: timed_statistics=false
Remove timed_statistics from init.ora
for 7.3 onwards: alter system set timed_statistics=false; |
|
for current session |
alter session set timed_statistics=true; |
alter session set timed_statistics=false; |
STATISTICS_LEVEL parameter of init.ora is introduced in Oracle 9.2. To see segment level statistics in execution plans, setting STATISTISCS_LEVEL to ALL is strongly recommended in session level.
MAX_DUMP_FILE_SIZE parameter of init.ora specifies the maximum size of trace files in operating system blocks. If your trace file is truncated then increase this value.
TRACEFILE_IDENTIFIER parameter of init.ora specifies a custom identifier that becomes a apart of generated trace file name. Such a custom identifier is used to identify a trace file simply from its name.
There are more than one way to generate trace file. The following table gives these methods:
|
Activation |
Level |
Enable |
Disable |
|---|---|---|---|
|
for current instance |
1 |
Add init.ora: sql_trace=true |
Add init.ora:
remove sql_trace from init.ora. |
|
All levels |
Add init.ora: |
Remove enabling parameter from init.ora. |
|
|
for current session |
1 |
alter session set sql_trace=true;
dbms_session.set_sql_trace(true); |
alter session set sql_trace=false;
dbms_session.set_sql_trace(false); |
|
All levels |
alter session set events '10046 trace name context forever, level <level#>';
DBMS_SUPPORT.START_TRACE(waits= <true||false>, binds= <false||false>); |
alter session set events '10046 trace name context off';
DBMS_SUPPORT.STOP_TRACE; |
|
|
for other session |
1 |
sys.dbms_system.set_sql_trace_in_session(<sid>,<serial#>,true); |
sys.dbms_system.set_sql_trace_in_session(<sid,<serial#,false); |
|
All levels |
DBMS_SUPPORT.START_TRACE_IN_SESSION(<sid>,<serial#>, waits= <true||false>, binds= <true||false>);
oradebug setorapid <OracleProcessID>
oradebug setospid <OperatingSystemProcessID>
oradebug event “10046 trace name context forever, level <level#>”
DBMS_SYSTEM.SET_EV(<sid>,<serial#>,10046,<level>,''); |
DBMS_SUPPORT.STOP_TRACE_IN_SESSION(<sid>,<serial#>);
oradebug event “10046 trace name context off”
|
Trace files are generated under USER_DUMP_DEST parameter of init.ora.
Note: If trace file is truncated or enabled from other session, itrprof SQL Analyzer may yield wrong results or errors in itrprof SQL Analyzer results. Because, if trace file is truncated, there will be no remaining information in trace files to analyze. Also, if a trace is enabled from other session, it's likely that when a trace is enabled, some information before enabling trace will not be available in trace file to analyze. So, enabling trace from other sessions are only recommended when users are sure that no information is missed in the trace file.
itrprof SQL Analyzer can catch corruptions in trace files while processing them. Catching corruptions depends on user's selections. For example, if users don't select BINDS or WAITS operations, no corruptions are catched in BINDS or WAITS lines, respectively.
itrprof handles corrupted lines in trace files in two ways:
"PARSING IN CURSOR" and "PARSE ERROR" lines are the most critical lines since they allocate new cursor number. If They are corrupted, processing subsequent lines of corrupted cursors may yield wrong results. If itrprof encounteres these type of corruptions, execution is stopped by an error.
itrprof SQL Analyzer doesn't stop execution, but reports corruptions, if corruption occurs in the following types of lines:
- "PARSE"
- "EXEC"
- "FETCH"
- "UNMAP"
- "SORT UNMAP"
- "STAT" --- See No Statistics available Execution Plan for further information.
- "WAITS"
- "ERROR"
- "XCTEND"
- "BINDS" --- See Corrupted Binds for further information
Corrupted lines are reported in Corrupted Lines and Their Dependents part of report.
The user interface of itrprof SQL Analyzer is as below:
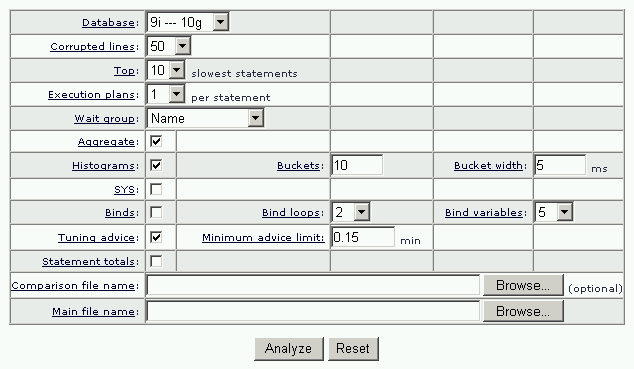
Version of database for which trace file is generated.
Maximum number of slowest statements reported, which have the slowest elapsed times.
Specifies number of execution plans of statements to be reported. The default value is 1 which means the first parse. If 'All' is selected, all execution plans will be examined for statements.
Exection plans are not reported if Comparison file name is in use.
Waits in trace files are reported if trace file is prepared in level 8 or level 12. It’s possible to group wait events in trace file by specifying group level.
The followings are the group levels:
The default value is Name.
If it’s selected, identical statements are reported as a single SQL statement. All values of identical statements are added up.
If not selected, each individial statement is reported separately.
If It's selected, service and wait times are grouped into their subsets to see their distribution. It's useful if service and wait times are not uniformly distributed.
Maximum number of subset of service and wait distributions.
Buckets interval time in millisecond.
If it’s not selected, SYS statements are not reported and processed in statement level. But, whether or not it’s selected, SYS values are always processed in overall level to find overall totals.
If it’s selected, Bind variables in trace files are reported if trace file is prepared in level 4 or level 12.
Whether or not it’s selected, Bind variables are not reported if Comparison file name is in use.
Maximum number of loops of which bind variables are reported.
If Binds is not selected, this parameter is ignored.
Maximum number of reported bind variables in a loop.
If Binds is not selected, this parameter is ignored.
If it’s selected, tuning advice is reported by depending on Minimum advice limit.
Determines whether tuning advice appears for an event in report. If event time in statement level or overall level is less than this parameter, tuning advice will not appear in itrprof output. This prevents itrprof from calculating tuning advices for low-impact statements. The default value is 0.15 minute.
If It's selected, the following overall totals are reported:
It's optional. If it's used, the difference of Main file name and this file is analyzed. The formula is as below:
Analysis = Main_file_name - Comparison_file_name
For example, if a statement in Main_file_name waited n second(s) for IO completion, and m second(s) in Comparison_file_name for the same event, the difference n - m is reported as the wait time for the same event. Notice that it's possible to see negative values if the values in Comparison_file_name is higher than the values in Main_file_name.
The comparison is based on SQL_TEXT in trace files. Different SQL_TEXTs are handled as different statements.
If it's not used, only Main file name is analyzed.
See Compression of request section to reduce uploading time, and see Preparing raw trace files section to see how trace files are generated.
Trace file name to be analyzed.
See Compression of request section to reduce uploading time, and see Preparing raw trace files section to see how trace files are generated.
This part reports logically corrupted lines encountered during execution. Values of corrupted lines are not included in the analysis results. Number of maximum reported corrupted lines is determined by Corrupted lines parameter.
| Errror code | Line number | Line |
|---|---|---|
| ----------- | ----------- | -------------------------------------------------------------------- |
| itp-05 [14] | 19 | STAT #34 id=2 cnt=3 pid=1 pos=1 obj=93804 op='INDEX UNIQUE SCAN ' |
| itp-05 [14] | 38 | STAT #13 id=2 cnt=1 pid=1 pos=1 obj=100146 op='INDEX UNIQUE SCAN ' |
| itp-05 [14] | 52 | STAT #10 id=1 cnt=1 pid=0 pos=0 obj=100146 op='INDEX UNIQUE SCAN ' |
| ----------- | ----------- | -------------------------------------------------------------------- |
In the above sample, 3 corrupted lines had been encountered, and all of them had been reported.
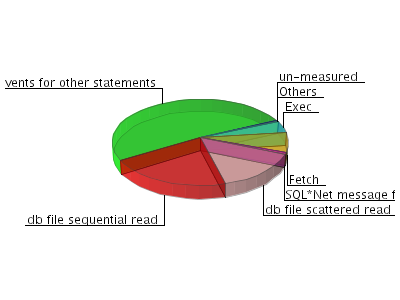
Overall part is grand totals of Statement parts. It consists of the following sections, respectively:
This section reports overall elapsed time totals of SYS and NON-SYS statements. It consits of two sub-sections:
Chart Section
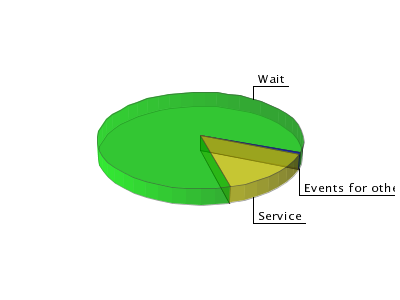
This section reports overall elapsed time totals in a chart.
OVERALL ELAPSED TIME TOTALS
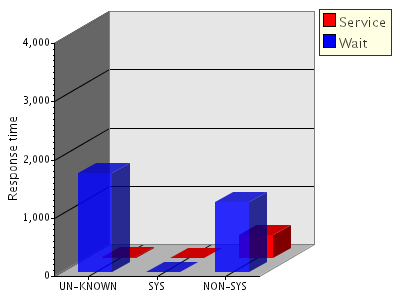
This section reports overall elapsed time totals in a table.
| Event | UN-KNOWN | SYS | NON-SYS | Total | in Overall(%) |
|---|---|---|---|---|---|
| -------- | ---------- | ---------- | ---------- | ---------- | -------------- |
| Service | 0.00 | 0.12 | 395.20 | 395.32 | 12% |
| Wait | 1,694.23 | 0.65 | 1,198.78 | 2,893.66 | 88% |
| -------- | ---------- | ---------- | ---------- | ---------- | -------------- |
| total | 1,694.23 | 0.77 | 1,593.98 | 3,288.98 | 100% |
UN-KNOWN: Times spent by UN-KNOWN users If the owner of statements are not known.
NON-SYS : Times spent by NON-SYS users.
SYS : Times spent by SYS user.
Total : Total of times spent by UN-KNOWN, NON-SYS and SYS users.
in Overall(%) : Percentage in overall total.
This section is optional. To see this section in report, Statement totals should be selected.
This section reports PARSE, EXEC, FETCH statistics of all NON-SYS statements. UNMAP and SORT UNMAP statistics are included in EXEC statistics. This section consists of two sub-sections:
Chart Section
This section reports service and wait times of in a chart. If Tuning advice is not selected, or total elapsed time of all NON-SYS statements is less than Minimum advice limit, this section is not printed.
OVERALL STATISTIC TOTALS FOR ALL NON-SYS STATEMENTS
This section reports PARSE, EXEC, FETCH operations.
| call | service time |
service count |
wait time |
wait count |
elapsed time |
disk | query | current | miss | rows |
|---|---|---|---|---|---|---|---|---|---|---|
| ---------- | -------- | -------- | -------- | -------- | ----------- | -------- | --------- | -------- | ----- | -------- |
| Parse | 0.23 | 95 | 0.48 | 21 | 0.71 | 63 | 201 | 0 | 12 | 0 |
| Exec | 149.93 | 2,070 | 222.84 | 88,076 | 372.77 | 402,631 | 410,481 | 215,340 | 0 | 605,034 |
| Fetch | 245.03 | 6,547 | 958.22 | 336,928 | 1,203.25 | 597,748 | 1,579,009 | 6 | 0 | 654,316 |
| ---------- | -------- | -------- | -------- | -------- | ----------- | -------- | --------- | -------- | ----- | -------- |
| total | 395.20 | 8,712 | 1,181.53 | 425,025 | 1,576.73 | 1,000,442 | 1,989,691 | 215,346 | 12 | 1,259,350 |
call : Type of operation to Oracle kernel.
service time : Time spent on CPU.
service count : Number of services on CPU.
wait time : Time spent in waits during statement processing. It doesn't include the wait events out of the statement processing.
wait count : Number of waits during statement processing. It doesn't include the wait events which are out of the statement processing.
elapsed time : Total of service time and wait time.
disk : Number of physical reads.
query : Number of logical reads in consistent mode.
current : Number of logical reads in current mode.
Miss : Number of misses in the cache.
Rows : Number of returned rows.
This section is optional. To see this section in report, both Histograms and Statement totals should be selected.
This section reports distributions of PARSE, EXEC, FETCH statistics. It consists of two sub-sections:
Chart Section
This section reports service histograms in a chart. If Tuning advice is not selected, or total elapsed time of all NON-SYS statements is less than Minimum advice limit, this section is not reported.
OVERALL SERVICE HISTOGRAM TOTALS FOR ALL NON-SYS STATEMENTS
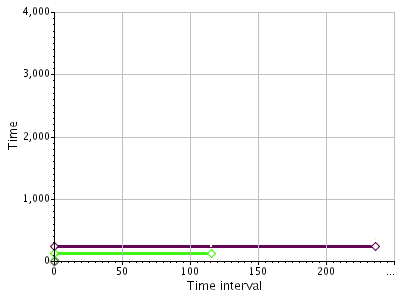
This section reports service histograms in a table.
| Event | Time interval | Time | Count | avg. Time | max. Time | in NON-SYS(%) | in Overall(%) |
|---|---|---|---|---|---|---|---|
| ------------------------------ | ------------------- | ---------- | ---------- | ---------- | ---------- | ---------------- | -------------- |
| Fetch | [0.040 .. 236.250] | 236.37 | 2 | 118.183 | 236.25 | 15% | 7% |
| Exec | [0.040 .. 115.600] | 121.13 | 108 | 1.122 | 115.60 | 8% | 4% |
| Exec | [0.030 .. 0.035) | 20.33 | 610 | 0.033 | 0.03 | 1% | 1% |
| Fetch | [0.015 .. 0.020) | 8.53 | 512 | 0.017 | 0.02 | 1% | 0% |
| Exec | [0.015 .. 0.020) | 8.47 | 508 | 0.017 | 0.02 | 1% | 0% |
| Fetch | [0.030 .. 0.035) | 0.13 | 4 | 0.033 | 0.03 | 0% | 0% |
| Parse | [0.040 .. 0.083] | 0.13 | 2 | 0.067 | 0.08 | 0% | 0% |
| Parse | [0.030 .. 0.035) | 0.07 | 2 | 0.033 | 0.03 | 0% | 0% |
| Parse | [0.015 .. 0.020) | 0.03 | 2 | 0.017 | 0.02 | 0% | 0% |
| Fetch | [0.000 .. 0.000] | 0.00 | 6,029 | 0.000 | 0.00 | 0% | 0% |
| Exec | [0.000 .. 0.000] | 0.00 | 844 | 0.000 | 0.00 | 0% | 0% |
| Parse | [0.000 .. 0.000] | 0.00 | 89 | 0.000 | 0.00 | 0% | 0% |
| ------------------------------ | ------------------- | ---------- | ---------- | ---------- | ---------- | ---------------- | -------------- |
| total | [0.000 .. 236.250] | 395.20 | 8,712 | N/A | 236.25 | 25% | 12% |
Event : Event name.
Time interval: Interval of bucket time identified by Bucket width. Maximum number of unique time interval identified by Buckets.
Given in lower_limit .. upper_limit format for each bucket. '[' and ']' characters are inclusive, '(' and ')' characters are exclusive characters. [a .. b) means that lower limit of time a is included in bucket, but upper limit of time b is not included. Exlusive upper limit of time b of this bucket is the inclusive lower limit of another higher bucket.
Upper and lower limit of minimum bucket interval is 0 ([0.000 .. 0.000]) to measure zero timed calls. Upper limit of highest bucket is the maximum time of event.
Time : Bucket time.
Count : Number of events in bucket.
avg. Time : Average time in bucket.
max. Time : Maximum time in bucket.
in NON-SYS(%) : Percentage of bucket time against total elapsed time of NON-SYS statements.
in Overall(%) : Percentage of bucket time against total elapsed time of overall statements.
This section is optional. To see this section in report, Statement totals should be selected.
This section reports wait totals for all NON-SYS statements. There are four different outputs according to Wait group parameter:
Wait events in trace file are grouped by wait event name. It consits of two sub-sections:
Chart Section
This section reports wait times in a chart.
OVERALL WAIT TOTALS FOR ALL NON-SYS STATEMENTS
This section reports wait information in a table.
| Name | Time | Count | avg. Time | max. Time | in NON-SYS(%) | in Overall(%) |
|---|---|---|---|---|---|---|
| ------------------------------ | -------- | -------- | ---------- | ---------- | ---------------- | -------------- |
| db file sequential read | 678.13 | 269,894 | 0.003 | 0.20 | 43% | 21% |
| db file scattered read | 485.79 | 120,016 | 0.004 | 0.18 | 30% | 15% |
| SQL*Net message from client | 17.19 | 8,708 | 0.002 | 2.12 | 1% | 1% |
| un-measured | 12.28 | 5,987 | 0.002 | 0.22 | 1% | 0% |
| direct path read | 3.59 | 9,729 | 0.000 | 0.05 | 0% | 0% |
| SQL*Net more data to client | 1.04 | 11,870 | 0.000 | 0.00 | 0% | 0% |
| SQL*Net more data from client | 0.52 | 4,837 | 0.000 | 0.00 | 0% | 0% |
| latch free | 0.09 | 399 | 0.000 | 0.02 | 0% | 0% |
| direct path write | 0.09 | 2,293 | 0.000 | 0.00 | 0% | 0% |
| SQL*Net message to client | 0.06 | 8,708 | 0.000 | 0.00 | 0% | 0% |
| buffer busy waits | 0.00 | 4 | 0.000 | 0.00 | 0% | 0% |
| ------------------------------ | -------- | -------- | ---------- | ---------- | ---------------- | -------------- |
| total | 1,198.78 | 442,445 | N/A | 2.12 | 75% | 36% |
Name : Wait event name.
Time : Time spent in wait.
Count : Number of wait calls.
Avg. Time : Average wait time per wait call.
max. Time : Maximum wait time.
in NON-SYS(%) : Percentage of wait time against total elapsed time of NON-SYS statements.
in Overall(%) : Percentage of wait time against total elapsed time of overall statements.
Wait events in trace file are grouped by wait event name and P1 parameter. The output of this section is similar to Name plus a column for P1 is added.
By this option, it’s possible to get valuable information defined by P1. For example, it’s possible to see time spent in specific Enqueue such as TX and others. Or, it’s possible to see time spent of specific IO waits on specific file.
Wait events in trace file are grouped by wait event name, P1 parameter and P2 parameter. The output of this section is similar to Name plus column for P1 and P2 are added.
By this option, it’s possible to get valuable information defined by P1 and/or P2. For example, it’s possible to see time spent in specific latch number in V$LATCH.LATCH#. Or, it’s possible to see time spent of specific IO waits on specific block of specific file.
Wait events in trace file are grouped by wait event name, P1 parameter, P2 parameter and P3 parameters. The output of this section is similir to Name plus column for P1,P2 and P3 are added.
This section has same meaning like in Overall Service Histogram Totals for All NON-SYS Statements except It includes wait histograms only.
According to Wait group parameter, there may be additional output columns which have the same meaning like in Overall Wait Totals for All NON-SYS Statements.
This section is optional. To see this section in report, both Tuning advice and Statement totals should be selected. If there is no NON-SYS event which has greater than or equal to Minimum advice limit time, this section is not reported even if Tuning advice and Statement totals are selected.
Tuning advices based on two costs: Time cost and Amount cost.
Time cost equals to elapsed time. Amount cost is the number of blocks waited or processed.
It’s possible to compare time costs or amount costs with other sessions time costs and amount costs, respectively. But, it’s not possible to compare time costs with amount costs.
Advices are ordered by time cost first and then by Amount cost.
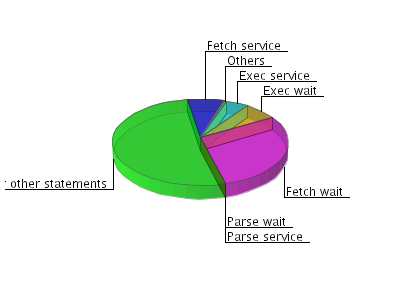
This section consits of 2 sub-sections:
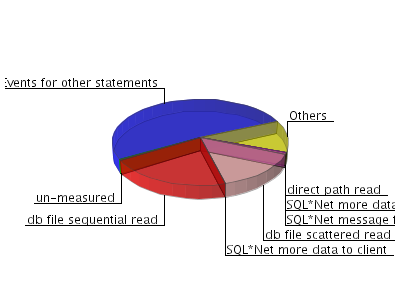
Chart section
Just first 7 events which have highest time costs are reported in the chart. Other events of NON-SYS statements are reported as Others; other events of SYS and UN-KNOWN statements are reported as Events for other statements.
OVERALL TUNING ADVICEs FOR ALL NON-SYS STATEMENTS
This section reports advices of all events which have a time cost greater than or equal to Minimum advice limit.
Grouping wait events in Wait group section groups wait events in Tuning advice section, too. Here is a sample that wait events are grouped by Name:
| Time cost | Amount cost | Event | Tuning advice |
|---|---|---|---|
| 678.13 | 269,894 | db file sequential read | (P1,P2,P3) correspond to (file#,currently reading block#,number of blocks read(should be 1)) respectivly. Waited for IO completion of : - single block read - multiple blocks sort read Number of single block reads : 269,894 Total single blocks read time : 678.13 seconds if time based cost is acceptable, ignore it. if time based cost is acceptable, but amount based cost is unacceptable, it's a potential problem for future. Check IO: - Don't use RAID5 or use with better stripe size. - Use Raw devices versus File System Files. - Run itrprof with minimum waitgroup of (name,P1) to see distribution of file IO. - Distribute busy data files files from busy disks to non-busy disks. - Use Asynchonous IO if available. Check SQL statements to use better index(es). Increase DB_BLOCK_BUFFERS to reduce IO without causing paging or swapping. |
| 485.79 | 952,482 | db file scattered read | (P1,P2,P3) correspond to (file#,starting block#,number of blocks read) respectivly. Waited for IO completion of : - Full Table Scan(FTS) - Index Fast Full Scan Number of multible blocks reads : 952,482 Total multible blocks read time : 485.79 seconds if time based cost is acceptable, ignore it. if time based cost is acceptable, but amount based cost is unacceptable, it's a potential problem for future. Check IO: - Don't use RAID5 or use with better stripe size. - Use Raw devices versus File System Files. - Run itrprof with minimum waitgroup of (name,P1) to see distribution of file IO. - Distribute busy data files files from busy disks to non-busy disks. - Use Asynchonous IO if available. Check SQL statements doing FTS. Use proper index(es). Increase DB_BLOCK_BUFFERS without causing paging or swapping to reduce IO. |
| 245.03 | 1,579,015 | Fetch | CPU time : 245.03 seconds Elapsed time : 1,203.25 seconds Number of Fetch : 6,547 Number of fetched rows : 654,316 Number of logical reads for Fetch: 1,579,015 Number of physical reads for Fetch: 597,748 1,579,015 logical reads and 597,748 physical reads had been done to fetch 654,316 rows. logical reads per fetched row : 2.41 This ratio should get close to 0. If it's unacceptable, check missing index(es) and/or use parallel query with multiple-CPUs. If parallel query is not an option, adding CPUs does not make benefit for a unique process/thread. In this case, increase CPU power. fetched rows per fetch : 99.94 This ratio should be as high as possible. If it's unacceptable, arrayfetching should be configured. Difference between Elapsed time and CPU time : 958.22 seconds If it is unacceptable, check Fetch related Oracle wait events and/or CPU scheduling of OS. Hit ratio for Fetch : 62% If there is no IO related wait event, ignore it. Otherwise, 80% and higher are recommended. |
| 149.93 | 625,821 | Exec | CPU time : 149.93 seconds Elapsed time : 372.77 seconds Number of updated rows : 605,034 Number of searched blocks to find the rows to update : 410,481 Number of updated blocks : 215,340 Number of physical reads for Exec: 402,631 402,631 physical reads had been done, 410,481 blocks had been searched and 215,340 blocks had been updated to update 605,034 rows. searched blocks per updated rows :0.68 This ratio should get close to 0. If it's unacceptable, check missing index(es) and/or use parallel query with multiple-CPUs. If parallel query is not an option, adding CPUs does not make benefit for a unique process/thread. In this case, increase CPU power. searched blocks per updated blocks :1.91 This ratio should get close to 1. If it's unacceptable, check missing index(es). Difference between Elapsed time and CPU time : 222.84 seconds If it is unacceptable, check Exec related Oracle wait events and/or CPU scheduling of OS. Hit ratio for Exec : 36% If there is no IO related wait event, ignore it. Otherwise, 80% and higher are recommended. |
| 17.19 | SQL*Net message from client | (P1,P2,P3) correspond to (driver id, bytes received from client, not used) respectivly. Waited for a message to arrive from the client since the last message was sent to the client. This event may be idle(ignorable) or non-idle wait event. There is no 100% accurate rule to determine if this wait event is idle or not. But, there are some useful indicators. It's idle(ignorable), if user waited as idle in client side, such as SQL*Plus, Forms, etc., without sending message to database. Indicator: Usually high wait times and small wait counts It's non-idle, if user started sending message to database. Indicator: Usually high wait counts and other SQL*Net related wait events appear, too If it is idle, do: - Ignore it. - Always generate trace files when users are not idle. If it is non-idle, do: - Check if the client is busy to send a message to the database. - Check network delays. - Increase SDU/TDU parameters of SQL*Net at both client and server side. - Increase arraysize related parameter on client tool without causing SQL*Net more data from client wait event. |
|
| 12.28 | un-measured | Number of zero timed services : 6,962 Number of zero timed service related waits : 811 Wait events available : true A pseudo event not measured by Oracle. Time spent in this event consists of the followings: Inactive Service Time: It's a new technical term introduced by ubTools. If a running process is interrupted ,without entering Oracle wait events, by OS for OS activities such as context switch, paging, swapping etc., process is called in inactive service state. Time spent in this state is not controled and not measured by Oracle. Inactive Wait Time: It's another new technical term introduced by ubTools. It's the time spent in Oracle wait events. Time spent in this state is controled and measured by Oracle. If wait events are available in trace file to analyze, time spent in the waits during statement processing is NOT included in this un-measured pseudo event. In this case, they are reported in their real event names. If wait events are not available to analyze, time spent in the waits during statement processing is included in this un-measured pseudo event. Zero timed events: Time granularity in pre-Oracle9i is 1/100. It's 1/1000000 with Oracle9i. If an event time is less than these limits, it's measured as 0 by Oracle. 6,962 service calls, 811 service related wait calls had been measured as 0 by Oracle. High values with high time cost increase the possibility of un-measured time in zero timed calls. Low values with high time cost increase the possiblity of un-measured time in inactive service state. In this case, check OS resources. Wait events are available to analyze. |
This section has the same meaning like in Overall Statistic Totals for All NON-SYS Statements except It includes SYS user statistics only.
This section has the same meaning like in Overall Service Histogram Totals for All NON-SYS Statements except It includes SYS user service histograms only.
This section has the same meaning like in Overall Wait Totals for All NON-SYS Statements except It includes SYS user waits only.
This section has the same meaning like in Overall Wait Histogram Totals for All NON-SYS Statements except It includes SYS user wait histograms only.
This section has the same meaning like in Overall Tuning Advices for All NON-SYS Statements except It includes SYS user tuning advices only.
This section has the same meaning like in Overall Wait Totals for All NON-SYS Statements except It includes UN-KNOWN user waits only.
This section has the same meaning like in Overall Wait Histogram Totals for All NON-SYS Statements except It includes UN-KNOWN user wait histograms only.
This section has the same meaning like in Overall Tuning Advices for All NON-SYS Statements except It includes UN-KNOWN user tuning advices only.
If All is selected in the Top slowest statements parameter, just first 7 statements which have highest elapsed times are reported. Otherwise, selected amount of top slowest statements are reported. If SYS statement is not selected, total elapsed time of SYS statements is reported as SYS statement(s) with the Statement# of 0. All other statements are reported as -1.
This section consits of 2 sub-sections:
Chart section
Shows elapsed times of statements in a chart.
TOP STATEMENTS ORDERED BY ELAPSED TIME
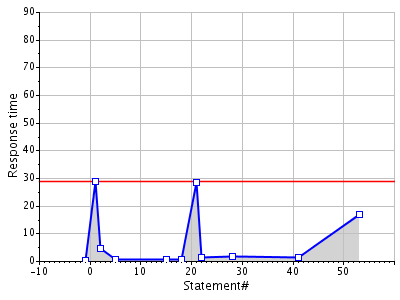
Shows elapsed times of statements in a table.
| Statement# | Statement | Elapsed time | Service time | Wait time | Logical IO | in Overall(%) |
|---|---|---|---|---|---|---|
| ----------- | --------------------------------------------------- | -------------- | ------------- | ---------- | ----------- | -------------- |
| 1 | alter session set events '10046 trace name context | 28.77 | 0.00 | 28.77 | 0 | 34% |
| 21 | commit | 28.52 | 0.05 | 28.47 | 1 | 33% |
| 53 | select * from dual | 16.95 | 0.02 | 16.94 | 3 | 20% |
| 2 | insert into transaction(ROWNO, DIRECTION, MOBILE, | 4.74 | 0.16 | 4.58 | 36 | 6% |
| 28 | begin mdsys.sdo_idx.cmt_idx_chngs('XYZ', 'L | 1.82 | 1.73 | 0.08 | 128 | 2% |
| 41 | begin mdsys.sdo_idx.cmt_idx_chngs('XYZ', 'L | 1.42 | 1.41 | 0.02 | 43 | 2% |
| 22 | begin mdsys.sdo_idx.cmt_idx_chngs('XYZ', 'L | 1.36 | 1.22 | 0.14 | 3 | 2% |
| 18 | UPDATE LOG_EVENT_LAST SET ROWNO=:B25 , SEQNO=1, TR | 0.73 | 0.73 | 0.00 | 11 | 1% |
| 5 | INSERT INTO LOG_LOCATION (TRANSACTION_ROWNO, TIME_ | 0.68 | 0.67 | 0.00 | 47 | 1% |
| 15 | INSERT INTO LOG_EVENT (ROWNO, SEQNO, TRANSACTION_R | 0.66 | 0.66 | 0.01 | 15 | 1% |
| -1 | Other statement(s) | 0.20 | 0.11 | 0.09 | 1,015 | 0% |
| ----------- | --------------------------------------------------- | -------------- | --------- | ---------- | ----------- | -------------- |
| total | 85.85 | 6.75 | 79.10 | 1,302 | 100% |
Statement# : Statement number.
Statement : Abbreviated statement text.
Elapsed time : Total of service time and wait time.
Service time : Service time.
Wait time : Wait time.
in Overall (%) : Percentage against total elapsed time of overall statements.
This section has the same meaning like in Top Statements Ordered by Elapsed Time except It is based on and ordered by service time.
This section has the same meaning like in Top Statements Ordered by Elapsed Time except It is based on and ordered by wait time.
This section has the same meaning like in Top Statements Ordered by Elapsed Time except It is based on and ordered by logical IO.
This part consists of the following sections, respectively:
This section shows statment text. If SQLID is not available in trace file, it's not printed. This section is not optional. It’s always reported for statements.
STATEMENT 3
(Hash:942515969 SQLID:a5ks9fhw2v9s1)
select * from dual
This section shows service and wait times with their ratios in statement and overall. This section is the starting point of tuning statement. If service time is dominant, service time should be broken down in Statistic Totals for Statement section. If Wait time is dominant, wait time should be broken down in Wait Totals for Statement section.
It consits of two sub-sections:
Chart Section
This section shows elapsed time information in a chart. If Tuning advice is not selected, or total elapsed time of the statement is less than Minimum advice limit, this section is not reported.
ELAPSED TIME TOTALS FOR STATEMENT
This section reports elapsed time information in a table.
| Event | Time | in Statement(%) | in Overall(%) |
|---|---|---|---|
| -------- | --------- | ---------------- | -------------- |
| Service | 66.77 | 15% | 15% |
| Wait | 384.29 | 85% | 85% |
| -------- | --------- | ---------------- | -------------- |
| total | 451.06 | 100% | 100% |
in Statement(%) : Percentage of time in statement level.
in Overall(%) : Percentage of time in overall level.
This section reports the exclusive statistics of the statement. Statistics of statement's child(resursive) statements are not included in this section.
This section has the same meaning like in Overall Statistic Totals for All NON-SYS Statements except It includes current statement's exlusive statistics only.
This section reports the exclusive service histograms of the statement. Service histogram statistics of statement's child(recursive) statements are not included in this section.
This section has the same meaning like in Overall Service Histogram Totals for All NON-SYS Statements except It includes current statement's exclusive service histograms only.
This section reports the cumulative statistics of the statement. Statistics of statement's child(resursive) statements are included in this section.
This section has the same meaning like in Overall Statistic Totals for All NON-SYS Statements except It includes current statement's cumulative statistics only.
This section reports the child(recursive) statements of the statement.
| Statement# | Time cost | in Statement(%) | in Overall(%) | Statement |
|---|---|---|---|---|
| ----------- | ----------- | ---------------- | -------------- | -------------------------------------------------- |
| 7 | 0.06 | 67% | 0% | Current statement (exclusive) |
| 10 | 0.03 | 31% | 0% | insert into plan_table (statement_id, timestamp, o |
| 11 | 0.00 | 2% | 0% | select o.name, u.name from sys.obj$ o, sys.user$ u |
| ----------- | ----------- | ---------------- | -------------- | -------------------------------------------------- |
| total | 0.09 | 100% | 0% |
Time cost : Cumulative elapsed time total.
in Statement (%) : Percentage of elapsed time in statement level.
in Overall (%) : Percentage of elapsed time in overall level.
This section has the same meaning like in Overall Wait Totals for All NON-SYS Statements except It includes current statement's waits only.
This section has the same meaning like in Overall Wait Histogram Totals for All NON-SYS Statements except It includes current statement's wait histograms only.
This section reports execution plans defined by Execution plans. It's optional.
There are three possible outputs for execution plans:
If there are execution plan statistics in the trace files and they are not corrupted, exection plan is printed without a warning.
As seen in the following sample, same statement is parsed twice:
| Statistic | Value |
|---|---|
| ----------------------- | --------------- |
| Parse number | 1 |
| Parsing User ID | 1,669 |
| Relative starting time | Second 457.05 |
| Recursive depth | 0 |
| Optimizer goal | Choose |
| Operation ID |
Operation | Rows | Object ID |
|---|---|---|---|
| ---------- | --------------------------------------------------------------- | ---------- | ------- |
| 1 | SORT ORDER BY (cr=1186 r=0 w=0 time=385551 us) | 4 | 0 |
| 2 | CONNECT BY WITH FILTERING (cr=1186 r=0 w=0 time=384886 us) | 4 | 0 |
| 3 | NESTED LOOPS (cr=238 r=0 w=0 time=39296 us) | 1 | 0 |
| 4 | TABLE ACCESS FULL PLAN_TABLE (cr=237 r=0 w=0 time=39248 us) | 1 | 16,965 |
| 5 | TABLE ACCESS BY USER ROWID PLAN_TABLE (cr=1 r=0 w=0 time=34 us) | 1 | 16,965 |
| 6 | HASH JOIN (cr=948 r=0 w=0 time=343968 us) | 3 | 0 |
| 7 | CONNECT BY PUMP (cr=0 r=0 w=0 time=101 us) | 4 | 0 |
| 8 | TABLE ACCESS FULL PLAN_TABLE (cr=948 r=0 w=0 time=167187 us) | 43,448 | 16,965 |
| Operation ID |
Operation | Time | Consistent Read |
Physical Read |
Physical Write |
Rows | Object ID |
|---|---|---|---|---|---|---|---|
| ---------- | ---------------------------------------- | ---------- | ----------- | --------- | --------- | ---------- | ------- |
| 6 | HASH JOIN | 0.176680 | 0 | 0 | 0 | 3 | 0 |
| 8 | TABLE ACCESS FULL PLAN_TABLE | 0.167187 | 948 | 0 | 0 | 43,448 | 16,965 |
| 4 | TABLE ACCESS FULL PLAN_TABLE | 0.039248 | 237 | 0 | 0 | 1 | 16,965 |
| 2 | CONNECT BY WITH FILTERING | 0.001622 | 0 | 0 | 0 | 4 | 0 |
| 1 | SORT ORDER BY | 0.000665 | 0 | 0 | 0 | 4 | 0 |
| 7 | CONNECT BY PUMP | 0.000101 | 0 | 0 | 0 | 4 | 0 |
| 5 | TABLE ACCESS BY USER ROWID PLAN_TABLE | 0.000034 | 1 | 0 | 0 | 1 | 16,965 |
| 3 | NESTED LOOPS | 0.000014 | 0 | 0 | 0 | 1 | 0 |
| ---------- | ---------------------------------------- | ---------- | ----------- | --------- | --------- | ---------- | ------- |
| total | 0.385551 | 1,186 | 0 | 0 | 43,466 | N/A |
| Statistic | Value |
|---|---|
| ----------------------- | --------------- |
| Parse number | 2 |
| Parsing User ID | 1,669 |
| Relative starting time | Second 485.22 |
| Recursive depth | 0 |
| Optimizer goal | Choose |
| Operation ID |
Operation | Rows | Object ID |
|---|---|---|---|
| ---------- | --------------------------------------------------------------- | ---------- | ------- |
| 1 | SORT ORDER BY (cr=712 r=0 w=0 time=167887 us) | 2 | 0 |
| 2 | CONNECT BY WITH FILTERING (cr=712 r=0 w=0 time=167586 us) | 2 | 0 |
| 3 | NESTED LOOPS (cr=238 r=0 w=0 time=33215 us) | 1 | 0 |
| 4 | TABLE ACCESS FULL PLAN_TABLE (cr=237 r=0 w=0 time=33152 us) | 1 | 16,965 |
| 5 | TABLE ACCESS BY USER ROWID PLAN_TABLE (cr=1 r=0 w=0 time=36 us) | 1 | 16,965 |
| 6 | HASH JOIN (cr=474 r=0 w=0 time=134009 us) | 1 | 0 |
| 7 | CONNECT BY PUMP (cr=0 r=0 w=0 time=58 us) | 2 | 0 |
| 8 | TABLE ACCESS FULL PLAN_TABLE (cr=474 r=0 w=0 time=80931 us) | 21,720 | 16,965 |
| Operation ID |
Operation | Time | Consistent Read |
Physical Read |
Physical Write |
Rows | Object ID |
|---|---|---|---|---|---|---|---|
| ---------- | ---------------------------------------- | ---------- | ----------- | --------- | --------- | ---------- | ------- |
| 8 | TABLE ACCESS FULL PLAN_TABLE | 0.080931 | 474 | 0 | 0 | 21,720 | 16,965 |
| 6 | HASH JOIN | 0.053020 | 0 | 0 | 0 | 1 | 0 |
| 4 | TABLE ACCESS FULL PLAN_TABLE | 0.033152 | 237 | 0 | 0 | 1 | 16,965 |
| 2 | CONNECT BY WITH FILTERING | 0.000362 | 0 | 0 | 0 | 2 | 0 |
| 1 | SORT ORDER BY | 0.000301 | 0 | 0 | 0 | 2 | 0 |
| 7 | CONNECT BY PUMP | 0.000058 | 0 | 0 | 0 | 2 | 0 |
| 5 | TABLE ACCESS BY USER ROWID PLAN_TABLE | 0.000036 | 1 | 0 | 0 | 1 | 16,965 |
| 3 | NESTED LOOPS | 0.000027 | 0 | 0 | 0 | 1 | 0 |
| ---------- | ---------------------------------------- | ---------- | ----------- | --------- | --------- | ---------- | ------- |
| total | 0.167887 | 712 | 0 | 0 | 2,730 | N/A |
Parsing User ID : ID of user parsing statement.
Relative starting time : Relative elapsed time between the current statement and the first statement in the trace file.
Recursive depth : Level of recursion. If it’s 0, statement is a user statement, if it’s greater than 0, statement is a recursive statement.
Operation ID : The ID of operation.
Optimizer goal : Optimizer goal of statement which has the following four values: All_Rows, First_Rows, Rule, Choose.
Rows : Number of returned rows.
Operation : Row source access operation.
Object ID : Object id in DBA_OBJECTS.OBJECT_ID.
If there are segment level statistics in the operation columns of execution plans, exclusive statistics of operations are reported after the execution plan. If there is no segment level statistic or no way to compute exclusive segment level statistics by given segment statistics, no exclusive segment statistic is reported.
To dump segment level statistics in execution plan, see STATISTICS_LEVEL.
Here are the segment level statistic columns:
Operation ID : The ID of operation. This can be used to match operations in execution plan.
Operation : Row source access operation.
Time : Time spent in operation.
Consistent Read : Number of consistent reads.
Pyhsical Read : Number of physical reads.
Physical Write : Number of physical writes.
Rows : Number of returned rows.
Object ID : Object id in DBA_OBJECTS.OBJECT_ID.
Exection plans are dumped to trace files when cursors are closed. If there is no execution plan statistics for the statement in the trace file, a message is reported.
EXECUTION PLANs FOR STATEMENT
| Statistic | Value |
|---|---|
| ----------------------- | --------------- |
| Parse number | 1 |
| Parsing User ID | 1,669 |
| Relative starting time | Second 485.19 |
| Recursive depth | 0 |
| Optimizer goal | Choose |
| Operation ID |
Operation | Rows | Object ID |
|---|---|---|---|
| ---------- | --------------------------------------------------------------- | ---------- | ------- |
| No execution plan available in the trace file. |
If a corrupted line is encountered, execution plan of statement is not reported even if other operations of execution plan is correct. In this case, a message is printed.
EXECUTION PLANs FOR STATEMENT
| Statistic | Value |
|---|---|
| ----------------------- | --------------- |
| Parse number | 1 |
| Parsing User ID | 1,669 |
| Relative starting time | Second 285.19 |
| Recursive depth | 0 |
| Optimizer goal | Choose |
| Operation ID |
Operation | Rows | Object ID |
|---|---|---|---|
| ---------- | --------------------------------------------------------------- | ---------- | ------- |
| Canceled since corrupted line was encountered. |
This section reports bind variables defined by Bind loops and Bind variables. This section is optional. To see this section in report, Binds should be selected.
| Parse# | Loop# | Bind Position# | Value | Data Type |
|---|---|---|---|---|
| ------- | ------ | --------------- | ----------------------------------- | ---------- |
| 1 | 1 | 1 | "964" | VARCHAR2 |
| 1 | 1 | 2 | "2/19/2002 12:4:15" | DATE |
| 1 | 1 | 3 | 300 | NUMBER |
| 1 | 2 | 1 | "964" | VARCHAR2 |
| 1 | 2 | 2 | "2/19/2002 12:4:15" | DATE |
| 1 | 2 | 3 | 300 | NUMBER |
| ------- | ------ | --------------- | ----------------------------------- | ---------- |
Loop# : Loop number (such as loops in PL/SQL) in which bind variable is generated.
Bind Positition# : Bind position number in statement. It’s not a bind number. For example, the following INSERT stament has 1 variable, but 2 positions:
INSERT INTO TEST VALUES ( :b1 ,2 * :b1 )
pos#1 pos#2
Both bind pos#1 and bind pos#2 represents the value of same variable :b1. But, They have different position number.
If bind position is not given in trace file, null is reported.
Value : Value of bind variables. If value is not given in trace file, null is reported.
Data Type : Data type of bind variables. If data type is not known by itrprof SQL Analyzer or not available in trace file, null is reported.
If a corruption is encountered in bind position or bind data type, null value is reported as bind position or data type, respectively.
This section reports errors in trace files.
This section is not optional. Whenever an error is encountered in trace file, it’s always reported. If there is no error in trace file, this section is not reported.
| Type | Code | Count |
|---|---|---|
| ------ | ------ | ------ |
| Parse | 942 | 1 |
| non-Parse | 2292 | 16 |
Code: Error code.
Count: Number of errors encountered.
This section has the same meaning like in Overall Tuning Advices for All NON-SYS Statements except It includes current statement's Tuning advices only.
This part shows user interface parameters selected by user for analysis.
USER INTERFACE PARAMETERS
| Name | Value |
|---|---|
| --------------------------------------- | --------------------------------------- |
| Database | 9i --- 11g |
| Corrupted lines | 50 |
| Top slowest statements | 10 |
| Execution plans per statement | 1 |
| Wait group | Name |
| Aggregate | true |
| Histograms | true |
| Buckets | 10 |
| Bucket width | 5 |
| SYS | false |
| Binds | false |
| Bind loops | 2 |
| Bind variables | 5 |
| Tuning advice | true |
| Minimum advice limit | 0.15 |
| Statement totals | false |
| Comparison file name | |
| Main file name | C:\itrprof\TEST10046.zip |
This part shows trace file statistics.
TRACE FILE STATISTICS
| Name | Value |
|---|---|
| --------------------------------------- | ---------- |
| NON-SYS statements | 96 |
| SYS statements | 52 |
| UN-KNOWN statements | 3 |
| Unique statements | 33 |
| Commit | 5 |
| Rollback | 0 |
| Read-Only transactions | 3 |
| Read-Write transactions | 2 |
| Parse error | 0 |
| non-Parse error | 0 |
| Different sessions | 1 |
| Binds | 0 |
| Waits | 436562 |
| Corrupted lines | 0 |
NON-SYS statements : Number of NON-SYS user statements.
SYS statements : Number of SYS user statements.
UN-KNOWN statements : Number of UN-KNOWN user statements.
Unique statements : Number of unique statements. If Aggregate is not selected, it's not reported.
Commit : Number of commits.
Rollback : Number of rollbacks.
Read-Only transactions : Number of read-only transactions.
Read-Write transactions : Number of read-write transactions.
Parse error : Number of parse error.
non-Parse error : Number of errors other than parse error such as execution errors, fetch errors.
Different sessions : Number of different sessions.
Binds : Number of bind loops.
Waits : Number of waits.
Corrupted lines : Number of logically corrupted lines.
Although itrprof SQL Analyzer has very efficient optimized source code, there are some other optimization tips on user site such as compression trace files, eliminating unused data from trace files.
If there are a lot of SQL statements in trace files, and if just slowest statements are needed to analyze, use Top slowest satements option. This option consumes less bandwidth by sending just top N slowest statements to browser.
Since it's very likely to encounter too many unique wait groups of Name,P1,P2 and Name,P1,P2,P3 in trace files, grouping them may not be efficient. Unless the others are specified, Wait group of Name is recommended.
|
itrprof SQL Analyzer 6.2.7 User Manual |